Climate Change Chart of Albany, USA
Comprehensive Climate Change Chart of Albany, USA: Monthly Averages and Impact Trends
Explore the changing climate in Albany, USA with insights from historical data. Discover how temperatures, rainfall, snowfall, and sunshine duration have evolved over the years.
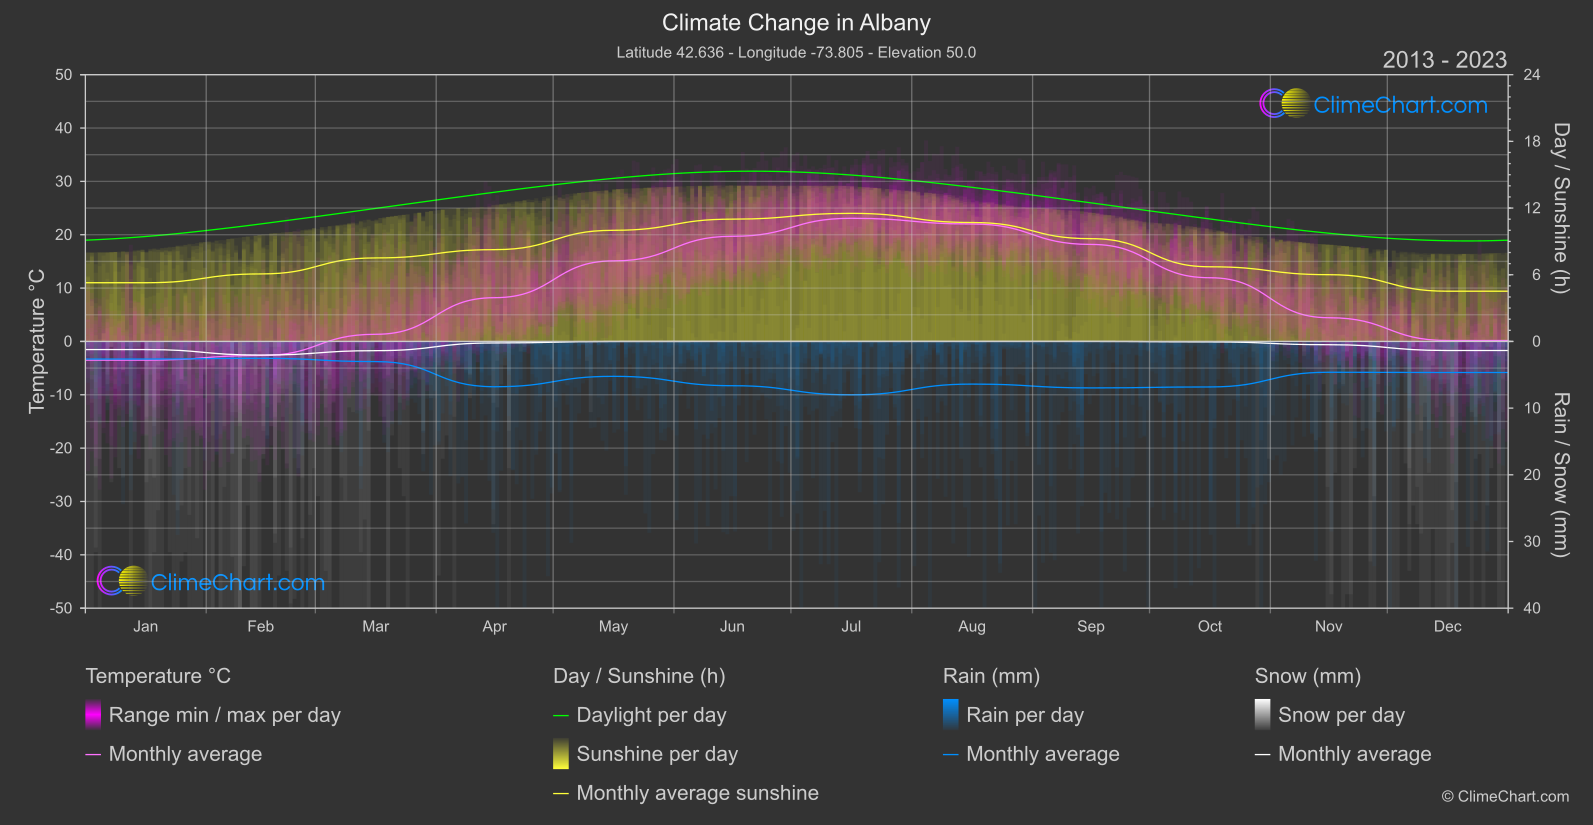
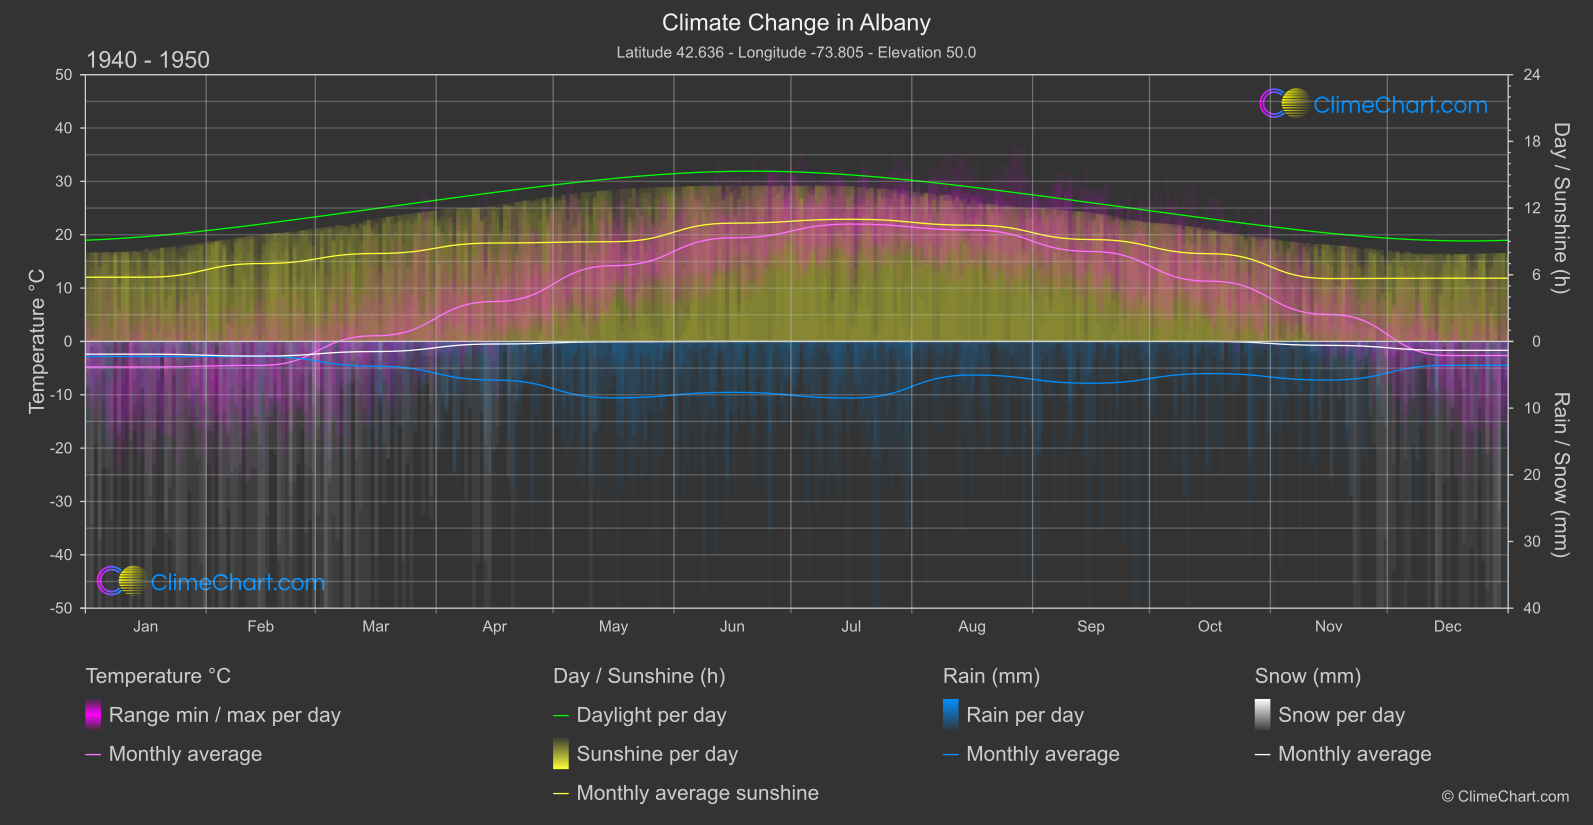
Albany, USA experiences notable changes in climate and weather patterns. From the data comparison between 1940 - 1950 and 2013 - 2024, it is evident that temperature has increased across most months, with December showing the highest change. Rainfall patterns have varied, with October exhibiting a significant increase. Snowfall has generally decreased over the years, with January having the most notable decline. Sunshine duration has fluctuated, with May showing a considerable increase in recent years.
Climate Change Data Overview for Albany, USA
Explore the comprehensive climate change data for Albany, USA. This detailed table provides valuable insights into temperature variations, precipitation levels, and seasonal changes influenced by climate change, helping you understand the unique weather patterns of this region.
Temperature °C
| Month | ⌀ 1940 - 1950 | ⌀ 2013 - 2023 | +/- |
|---|---|---|---|
| Jan | -4.79 | -3.51 | 1.28 |
| Feb | -4.49 | -2.64 | 1.85 |
| Mar | 1.07 | 1.34 | 0.27 |
| Apr | 7.49 | 8.20 | 0.71 |
| May | 14.20 | 15.10 | 0.89 |
| Jun | 19.42 | 19.71 | 0.29 |
| Jul | 22.00 | 23.08 | 1.08 |
| Aug | 20.88 | 22.01 | 1.13 |
| Sep | 16.86 | 18.18 | 1.33 |
| Oct | 11.29 | 11.94 | 0.65 |
| Nov | 5.05 | 4.44 | -0.61 |
| Dec | -2.64 | 0.17 | 2.81 |
| ⌀ Month | 8.86 | 9.83 | 0.97 |
Sunshine (h)
| Month | ⌀ 1940 - 1950 | ⌀ 2013 - 2023 | +/- |
|---|---|---|---|
| Jan | 5.78 | 5.28 | -0.50 |
| Feb | 7.01 | 6.07 | -0.93 |
| Mar | 7.91 | 7.51 | -0.40 |
| Apr | 8.86 | 8.26 | -0.60 |
| May | 8.97 | 10.00 | 1.02 |
| Jun | 10.64 | 11.00 | 0.36 |
| Jul | 10.99 | 11.52 | 0.53 |
| Aug | 10.45 | 10.70 | 0.24 |
| Sep | 9.17 | 9.25 | 0.08 |
| Oct | 7.89 | 6.72 | -1.18 |
| Nov | 5.65 | 6.01 | 0.35 |
| Dec | 5.69 | 4.52 | -1.17 |
| ⌀ Month | 8.25 | 8.07 | -0.18 |
Rain (mm)
| Month | ⌀ 1940 - 1950 | ⌀ 2013 - 2023 | +/- |
|---|---|---|---|
| Jan | 1.13 | 1.32 | 0.19 |
| Feb | 1.12 | 1.26 | 0.14 |
| Mar | 1.86 | 1.51 | -0.35 |
| Apr | 2.89 | 3.40 | 0.50 |
| May | 4.23 | 2.62 | -1.62 |
| Jun | 3.81 | 3.32 | -0.49 |
| Jul | 4.25 | 4.00 | -0.25 |
| Aug | 2.52 | 3.20 | 0.68 |
| Sep | 3.14 | 3.48 | 0.35 |
| Oct | 2.41 | 3.41 | 1.00 |
| Nov | 2.90 | 2.31 | -0.59 |
| Dec | 1.79 | 2.33 | 0.54 |
| ⌀ Month | 2.67 | 2.68 | 0.01 |
Snow (mm)
| Month | ⌀ 1940 - 1950 | ⌀ 2013 - 2023 | +/- |
|---|---|---|---|
| Jan | 0.96 | 0.61 | -0.35 |
| Feb | 1.10 | 1.02 | -0.08 |
| Mar | 0.76 | 0.69 | -0.06 |
| Apr | 0.19 | 0.11 | -0.08 |
| May | 0.02 | 0.00 | -0.02 |
| Jun | 0.00 | 0.00 | 0.00 |
| Jul | 0.00 | 0.00 | 0.00 |
| Aug | 0.00 | 0.00 | 0.00 |
| Sep | 0.00 | 0.00 | 0.00 |
| Oct | 0.00 | 0.03 | 0.03 |
| Nov | 0.29 | 0.25 | -0.05 |
| Dec | 0.67 | 0.68 | 0.01 |
| ⌀ Month | 0.33 | 0.28 | -0.05 |