Climate Change Chart of Addis Ababa, Ethiopia
Comprehensive Climate Change Chart of Addis Ababa, Ethiopia: Monthly Averages and Impact Trends
Exploring the changing climate in Addis Ababa, Ethiopia reveals intriguing insights.
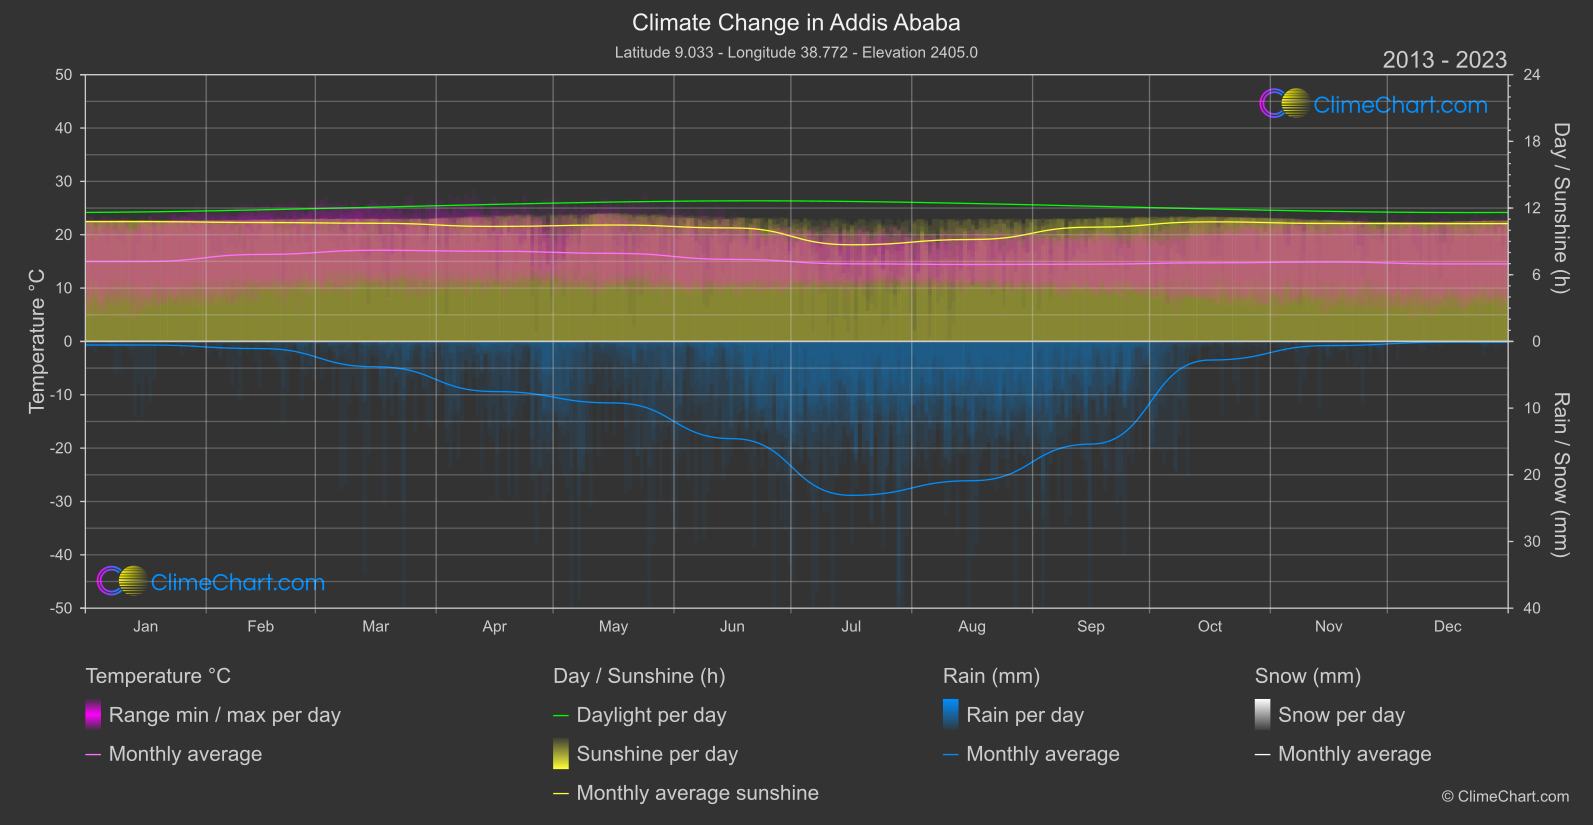
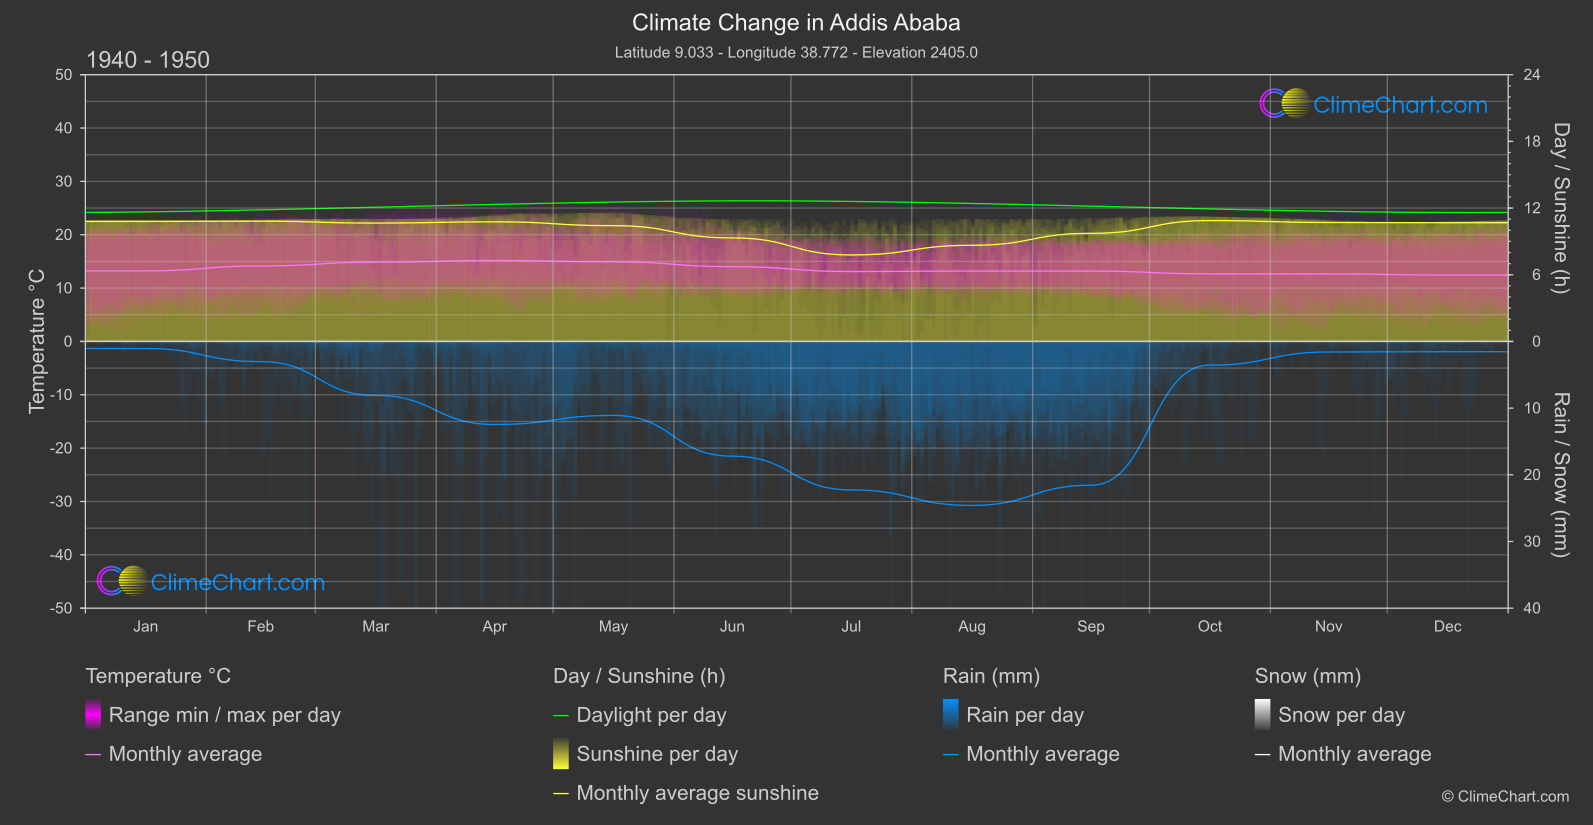
Addis Ababa, the capital of Ethiopia, has experienced notable changes in temperature, rainfall, and sunshine duration over the years. Analyzing the data from 1940 to 1950 compared to 2013 to 2024, we observe varying trends. For instance, the month of March shows a significant temperature rise of 2.23°C, while September indicates a rainfall decrease of 3.08mm. The sunshine duration also fluctuates, with June experiencing a notable increase of 0.90 hours.
Climate Change Data Overview for Addis Ababa, Ethiopia
Explore the comprehensive climate change data for Addis Ababa, Ethiopia. This detailed table provides valuable insights into temperature variations, precipitation levels, and seasonal changes influenced by climate change, helping you understand the unique weather patterns of this region.
Temperature °C
| Month | ⌀ 1940 - 1950 | ⌀ 2013 - 2023 | +/- |
|---|---|---|---|
| Jan | 13.22 | 14.99 | 1.76 |
| Feb | 14.15 | 16.31 | 2.16 |
| Mar | 14.86 | 17.08 | 2.23 |
| Apr | 15.16 | 16.90 | 1.73 |
| May | 14.92 | 16.51 | 1.59 |
| Jun | 14.02 | 15.38 | 1.36 |
| Jul | 13.10 | 14.54 | 1.44 |
| Aug | 13.19 | 14.42 | 1.23 |
| Sep | 13.19 | 14.48 | 1.29 |
| Oct | 12.67 | 14.74 | 2.07 |
| Nov | 12.67 | 14.88 | 2.22 |
| Dec | 12.43 | 14.53 | 2.09 |
| ⌀ Month | 13.63 | 15.40 | 1.76 |
Sunshine (h)
| Month | ⌀ 1940 - 1950 | ⌀ 2013 - 2023 | +/- |
|---|---|---|---|
| Jan | 10.80 | 10.78 | -0.02 |
| Feb | 10.82 | 10.70 | -0.12 |
| Mar | 10.65 | 10.63 | -0.02 |
| Apr | 10.76 | 10.35 | -0.41 |
| May | 10.42 | 10.47 | 0.06 |
| Jun | 9.31 | 10.21 | 0.90 |
| Jul | 7.78 | 8.69 | 0.92 |
| Aug | 8.65 | 9.17 | 0.52 |
| Sep | 9.73 | 10.28 | 0.55 |
| Oct | 10.87 | 10.76 | -0.11 |
| Nov | 10.70 | 10.62 | -0.09 |
| Dec | 10.68 | 10.60 | -0.08 |
| ⌀ Month | 10.10 | 10.27 | 0.17 |
Rain (mm)
| Month | ⌀ 1940 - 1950 | ⌀ 2013 - 2023 | +/- |
|---|---|---|---|
| Jan | 0.53 | 0.27 | -0.26 |
| Feb | 1.51 | 0.54 | -0.98 |
| Mar | 4.05 | 1.90 | -2.15 |
| Apr | 6.23 | 3.76 | -2.47 |
| May | 5.55 | 4.61 | -0.93 |
| Jun | 8.60 | 7.29 | -1.32 |
| Jul | 11.14 | 11.54 | 0.40 |
| Aug | 12.30 | 10.44 | -1.86 |
| Sep | 10.78 | 7.70 | -3.08 |
| Oct | 1.78 | 1.40 | -0.38 |
| Nov | 0.79 | 0.31 | -0.48 |
| Dec | 0.77 | 0.06 | -0.71 |
| ⌀ Month | 5.34 | 4.15 | -1.19 |
Snow (mm)
| Month | ⌀ 1940 - 1950 | ⌀ 2013 - 2023 | +/- |
|---|---|---|---|
| Jan | 0.00 | 0.00 | 0.00 |
| Feb | 0.00 | 0.00 | 0.00 |
| Mar | 0.00 | 0.00 | 0.00 |
| Apr | 0.00 | 0.00 | 0.00 |
| May | 0.00 | 0.00 | 0.00 |
| Jun | 0.00 | 0.00 | 0.00 |
| Jul | 0.00 | 0.00 | 0.00 |
| Aug | 0.00 | 0.00 | 0.00 |
| Sep | 0.00 | 0.00 | 0.00 |
| Oct | 0.00 | 0.00 | 0.00 |
| Nov | 0.00 | 0.00 | 0.00 |
| Dec | 0.00 | 0.00 | 0.00 |
| ⌀ Month | 0.00 | 0.00 | 0.00 |