Climate Change Chart of Aarhus, Denmark
Comprehensive Climate Change Chart of Aarhus, Denmark: Monthly Averages and Impact Trends
Explore the changing climate in Aarhus, Denmark with insightful data analysis.
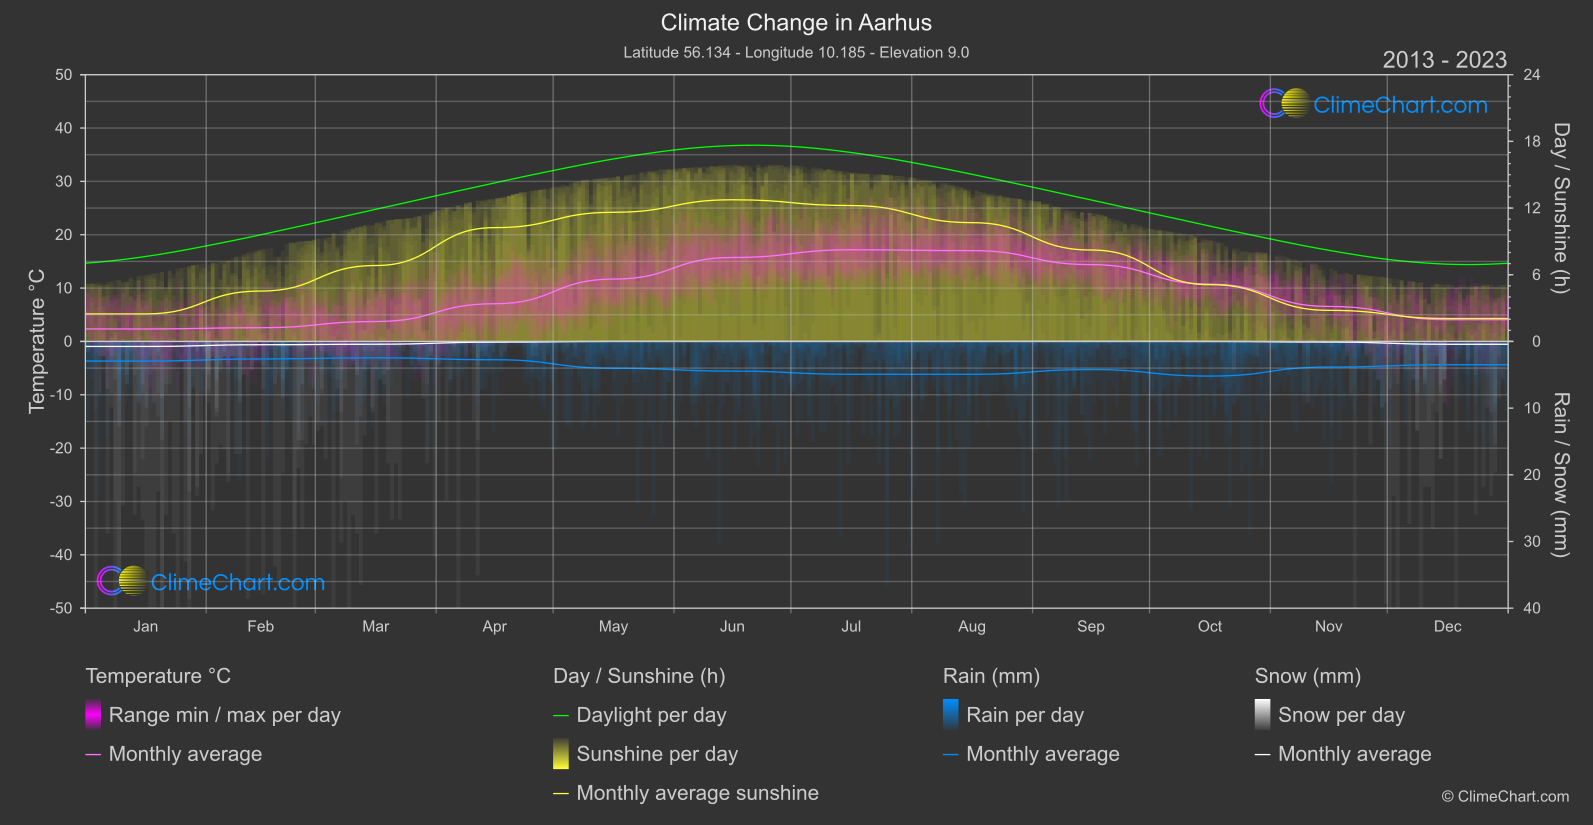
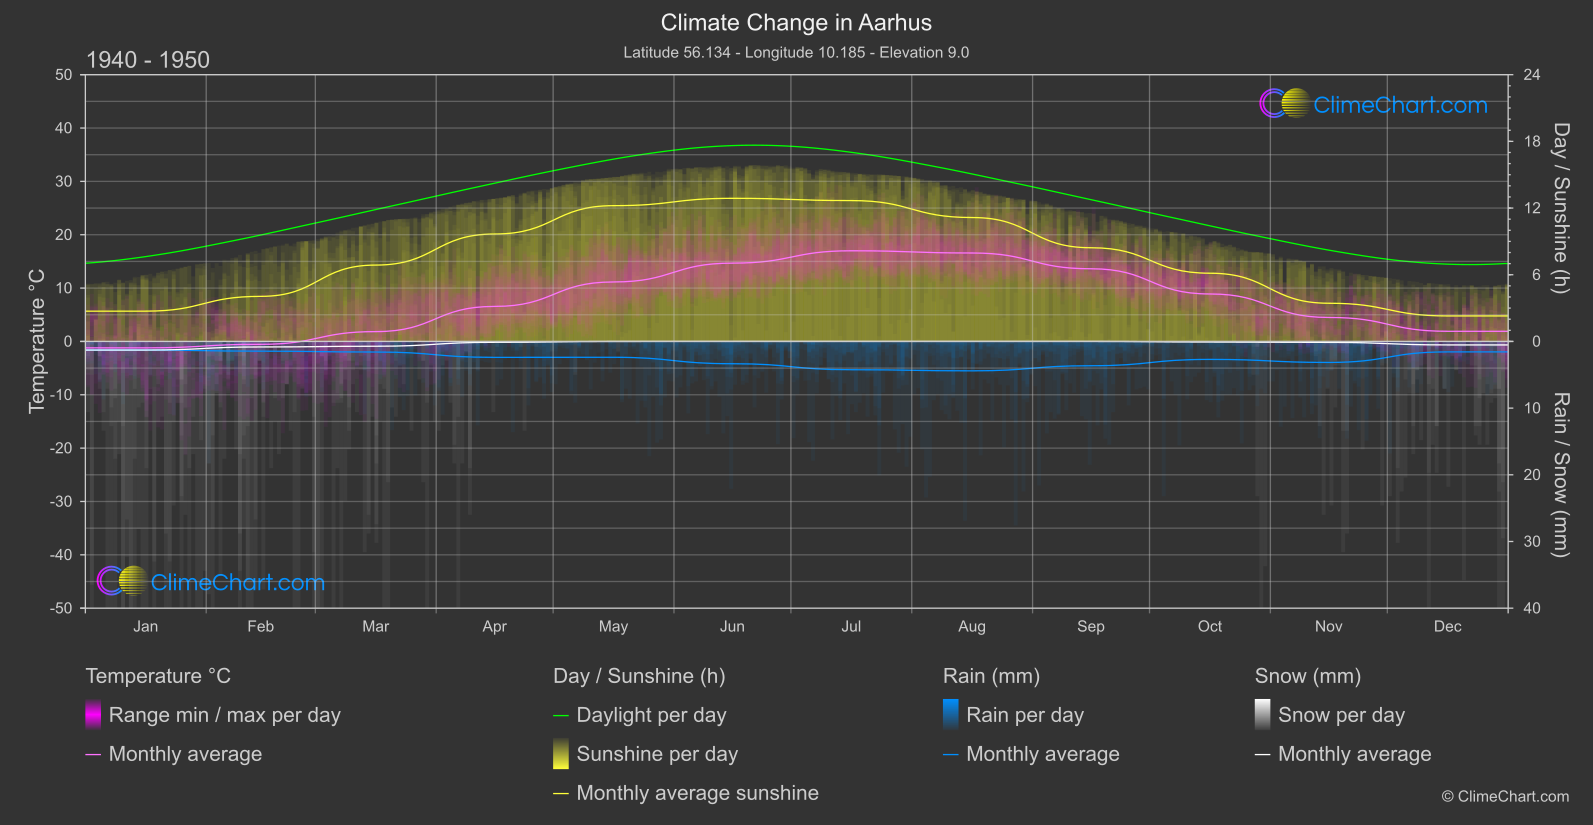
Aarhus, Denmark, experiences notable changes in temperature, rainfall, snowfall, and sunshine duration between the periods of 1940-1950 and 2013-2024. The data reveals shifts in climate patterns, such as increasing temperatures and varying precipitation levels. For instance, the month of April shows a significant increase in temperature, while October indicates a substantial rise in rainfall. Dive into the data to uncover more insights about the evolving climate in Aarhus.
Climate Change Data Overview for Aarhus, Denmark
Explore the comprehensive climate change data for Aarhus, Denmark. This detailed table provides valuable insights into temperature variations, precipitation levels, and seasonal changes influenced by climate change, helping you understand the unique weather patterns of this region.
Temperature °C
| Month | ⌀ 1940 - 1950 | ⌀ 2013 - 2023 | +/- |
|---|---|---|---|
| Jan | -1.21 | 2.34 | 3.54 |
| Feb | -0.54 | 2.57 | 3.11 |
| Mar | 1.84 | 3.74 | 1.89 |
| Apr | 6.56 | 7.06 | 0.50 |
| May | 11.15 | 11.69 | 0.54 |
| Jun | 14.68 | 15.74 | 1.06 |
| Jul | 16.99 | 17.18 | 0.19 |
| Aug | 16.58 | 17.02 | 0.44 |
| Sep | 13.62 | 14.40 | 0.78 |
| Oct | 8.90 | 10.73 | 1.83 |
| Nov | 4.49 | 6.56 | 2.07 |
| Dec | 1.90 | 4.08 | 2.17 |
| ⌀ Month | 7.91 | 9.42 | 1.51 |
Sunshine (h)
| Month | ⌀ 1940 - 1950 | ⌀ 2013 - 2023 | +/- |
|---|---|---|---|
| Jan | 2.72 | 2.48 | -0.25 |
| Feb | 4.05 | 4.53 | 0.48 |
| Mar | 6.87 | 6.83 | -0.04 |
| Apr | 9.67 | 10.24 | 0.57 |
| May | 12.22 | 11.62 | -0.60 |
| Jun | 12.88 | 12.75 | -0.13 |
| Jul | 12.67 | 12.23 | -0.45 |
| Aug | 11.15 | 10.69 | -0.46 |
| Sep | 8.43 | 8.23 | -0.20 |
| Oct | 6.14 | 5.11 | -1.03 |
| Nov | 3.44 | 2.80 | -0.64 |
| Dec | 2.29 | 2.06 | -0.23 |
| ⌀ Month | 7.71 | 7.46 | -0.25 |
Rain (mm)
| Month | ⌀ 1940 - 1950 | ⌀ 2013 - 2023 | +/- |
|---|---|---|---|
| Jan | 0.65 | 1.47 | 0.82 |
| Feb | 0.73 | 1.31 | 0.58 |
| Mar | 0.79 | 1.23 | 0.43 |
| Apr | 1.19 | 1.37 | 0.18 |
| May | 1.19 | 2.01 | 0.82 |
| Jun | 1.67 | 2.23 | 0.55 |
| Jul | 2.12 | 2.46 | 0.34 |
| Aug | 2.21 | 2.46 | 0.26 |
| Sep | 1.82 | 2.11 | 0.29 |
| Oct | 1.35 | 2.60 | 1.25 |
| Nov | 1.57 | 1.92 | 0.34 |
| Dec | 0.79 | 1.75 | 0.96 |
| ⌀ Month | 1.34 | 1.91 | 0.57 |
Snow (mm)
| Month | ⌀ 1940 - 1950 | ⌀ 2013 - 2023 | +/- |
|---|---|---|---|
| Jan | 0.65 | 0.38 | -0.27 |
| Feb | 0.41 | 0.25 | -0.17 |
| Mar | 0.36 | 0.21 | -0.15 |
| Apr | 0.07 | 0.05 | -0.01 |
| May | 0.00 | 0.00 | -0.00 |
| Jun | 0.00 | 0.00 | 0.00 |
| Jul | 0.00 | 0.00 | 0.00 |
| Aug | 0.00 | 0.00 | 0.00 |
| Sep | 0.00 | 0.00 | 0.00 |
| Oct | 0.05 | 0.00 | -0.04 |
| Nov | 0.07 | 0.05 | -0.02 |
| Dec | 0.26 | 0.21 | -0.05 |
| ⌀ Month | 0.16 | 0.10 | -0.06 |